
Hashrate: The edge for bitcoiners and treasury companies to earn more BTC and boost BTC Yield?
An analysis on mining vs buying and hashrate as a source of BTC Yield for BTC TCs


As a Bitcoiner who recently dove into the mining world, I have been closely monitoring the newest trends in this sector. Beyond developments such as solo mining, Stratum V2, and emerging ASIC manufacturers challenging Bitmain’s dominance, one trend gaining significant momentum is the idea that bitcoiners can maximize their BTC holdings by mining rather than buying spot on exchanges. Essentially, this approach allows individuals to grow their bitcoin stack faster. This is the core message from companies offering hosting services to both institutional and retail bitcoin investors. By mining bitcoin, you can acquire more BTC compared to simply purchasing it on the market. Similar to any commodity, this strategy consists of arbitraging the marginal cost of bitcoin against its market price, specifically leveraging the difference between electricity costs and bitcoin’s price.
There are additional arguments to mine bitcoin over buying it from someone—primarily centered around privacy—such as avoiding KYC/AML requirements and gaining access to virgin coins, which may hold greater value as fiat actors attempt to undermine bitcoin’s fungibility. Another argument is that mining is a very particular dollar-cost averaging strategy that individuals can use to reduce bitcoin’s volatility risk, especially if they anticipate an upcoming bull market. More on this later.
Let’s put these away for now and focus on analyzing which strategy offers the best risk-adjusted bitcoin returns: buying spot or mining. I have reviewed several mining calculators available on hosting providers’ websites, but they tend to concentrate solely on marginal costs and completely overlook the capital expenditure (capex) involved. Since no one could provide the information I needed, I developed a model by myself. BTC serves as the unit of account because the main objective is to grow BTC holdings over time rather than amassing more fiat currency. After all, we are bitcoiners.
To determine the daily BTC expenditure on electricity, I forecasted Bitcoin’s price by interpolating the user-provided price predictions and then divided the electricity cost in USD by the predicted Bitcoin price for each specific day. For simplification purposes, it’s assumed that there labour and rent cost are incorporated in the hosting fee that the miners pay. It’s also assumed that the network hashrate grows exponentially at a constant rate per difficulty epoch, without experiencing any reversals at all. For CAPEX considerations, the Sealminer A2 Pro Hydro is currently available on the market at a rate of $15 per TH and offers an efficiency of 15 J/TH. These pricing and efficiency parameters have been incorporated into the model.
The model does not account for complex dynamics—for instance, scenarios where network difficulty decreases as a result of the halving’s effect on miner profitability. Instead, it serves as a straightforward tool designed to offer a basic comparison between these two options: mining versus buying.
The model collects the following data:
The lifespan of the mining investment, typically assumed to be 3 or 4 years;
The total amount of deployed hashrate;
The current network hashrate;
The average difficulty adjustment per epoch throughout the project’s duration;
The average transaction fees earned per block in BTC;
The residual value percentage of the ASICs at the end of the project (it’s assumed that the ASICs are sold at the end of the project);
Electricity/hosting costs in USD per kwh;
ASICs price ($/TH);
ASICs efficiency (J/TH);
Pool fees and estimated downtime expressed as a percentage of total revenues;
Bitcoin price predictions in fiat currency;
The key variables that ultimately influence whether mining is a better option than buying are electricity costs, bitcoin’s USD price, and the average difficulty adjustment throughout the project.
Regarding electricity costs, the concept is straightforward: the lower the electricity price, the more profitable bitcoin mining becomes, and the greater the miner’s tolerance for potential declines in bitcoin’s price or increases in the difficulty.
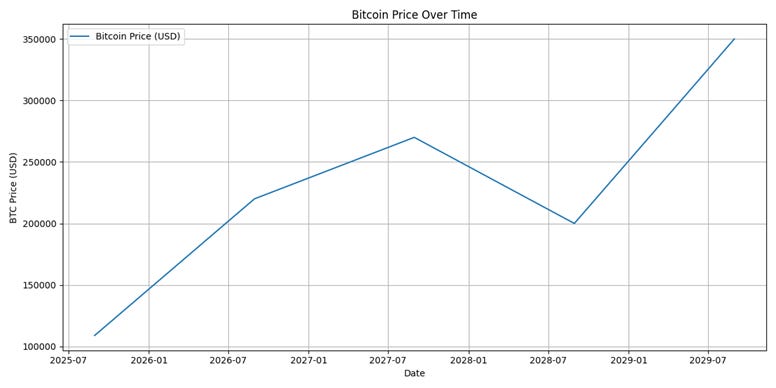
The relationship with bitcoin’s USD price can be a bit confusing, since the model uses bitcoin as the unit of account. Here’s the explanation: miners incur expenses in USD but generate revenue in BTC. So, if the BTC revenue stays constant but the bitcoin USD price drops, miners still face costs priced in USD. This means they must sell more bitcoin to cover those costs. Conversely, if the bitcoin USD price rises, miners need to sell less bitcoin, resulting in higher BTC mining profits. Recently, several models have been developed to forecast Bitcoin's price over the coming years, with the power law model gaining the most widespread support overall. These models can serve as guidance to input the necessary price predictions into the model. It’s also worth noting that miners now have access to a wide array of tools, including derivatives, enabling them to hedge their fiat exposure and stay neutral to fluctuations in the bitcoin price.
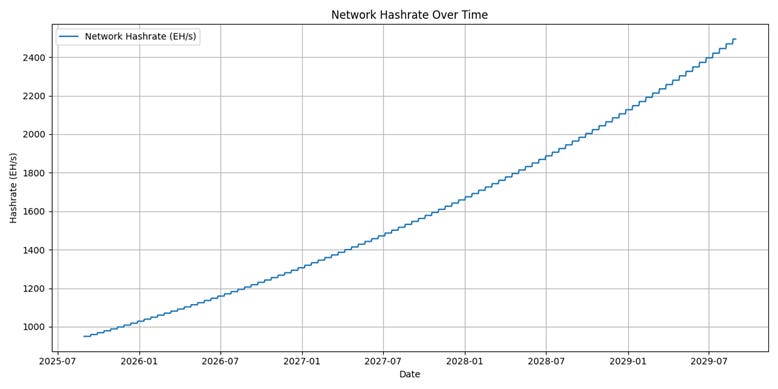
Finally, there is the difficulty adjustment that happens every 2016 blocks. When more hashrate joins the network, the difficulty increases, making it harder for miners to find blocks. Conversely, if the hashrate decreases, the difficulty lowers, making block discovery easier for miners. Examining the recent growth of the network hashrate and considering Bitcoin mining's potential to address energy challenges, such as monetizing stranded energy, there is broad agreement that Bitcoin's hashrate will continue to increase in the coming years. The key question that remains is determining the extent of this growth.
Looking at how fast difficulty grew in the past 12 months; one can easily calculate an average difficulty adjustment per epoch. Since the end of august of 2024, the network’s hashrate grew around 45%. This number translates into an average 1.44% increase every epoch. Because efficiency improvements in ASICs have decelerated in recent years, due to difficulties in further shrinking semiconductor sizes and the inherent physical limits of current hardware, it’s reasonable to expect that the growth rate of hashrate will continue to slow down in the years ahead.
In my view, the difficulty adjustment represents the greatest risk for anyone considering mining Bitcoin rather over buying it today. With the US adopting a positive stance on Bitcoin and numerous countries aiming to move away from the dollar system, many governments are beginning to recognize the benefits of Bitcoin mining. As a result, the possibility of a sovereign nation deploying a substantial amount of hash rate, increasing the difficulty significantly, should never be ignored. Moreover, there are tools that miners can use to manage their risk exposure to energy prices and Bitcoin price fluctuations. However, managing network difficulty is more challenging, though new solutions are starting to emerge to address this issue.
Buying BTC vs Mining BTC
Let’s now input the following parameters into the model and analyze the results.
4 years
1 ph/s
950 eh/s
1%
0.20 BTC
15%
0.05 USD
15 $/TH
15 J/TH
2.5%
In 1 year from now: 220k
In 2 years from now: 270k
In 3 years from now: 200k
In 4 years from now: 350k
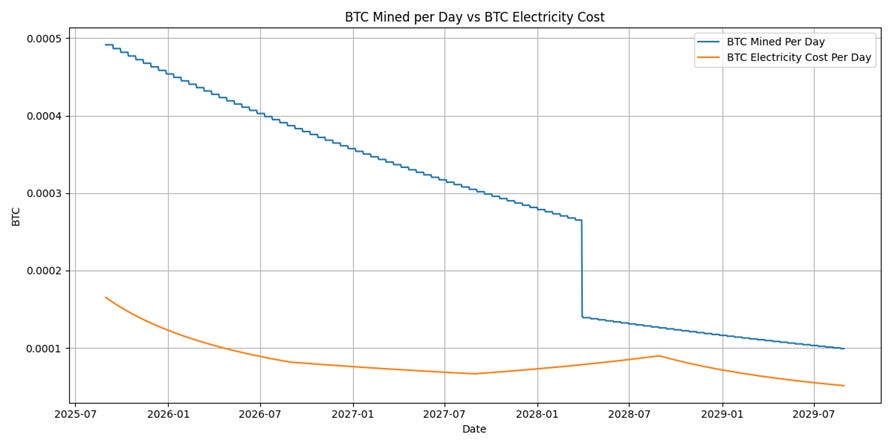
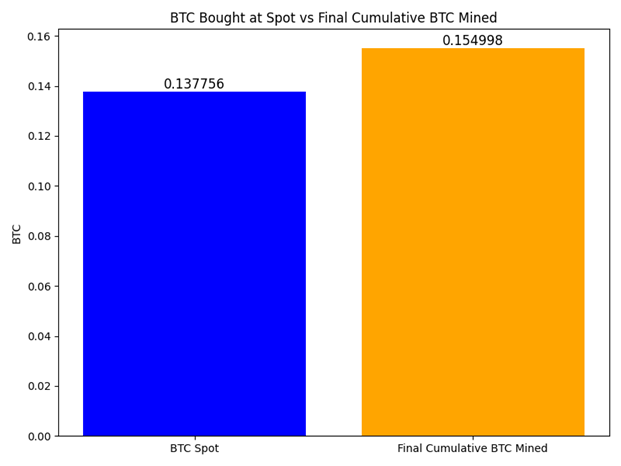
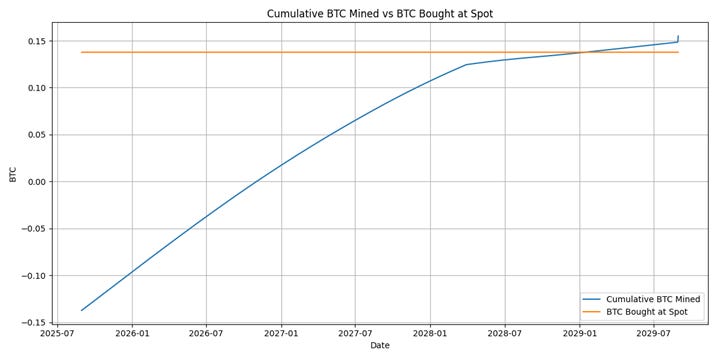
In this scenario, despite the halving’s impact on BTC profitability, mining remains the most profitable investment endeavour. The graphs clearly illustrate the severe effect of the halving on miners’ BTC margins and show a long-term trend where the amount of BTC mined per day approaches the miners’ daily electricity costs. To combat this trend, miners have only one viable option: upgrading their equipment to more efficient machines that deliver higher hashrate per unit of energy consumed. This necessity highlights why mining is viewed as a capital-intensive (high capex) industry, and when coupled with its intense competition, it may not represent the best investment opportunity. Unless miners have access to very low-cost electricity, deploying capital elsewhere, such as stacking sats through normal market purchases, is surely the best risk-adjusted option.
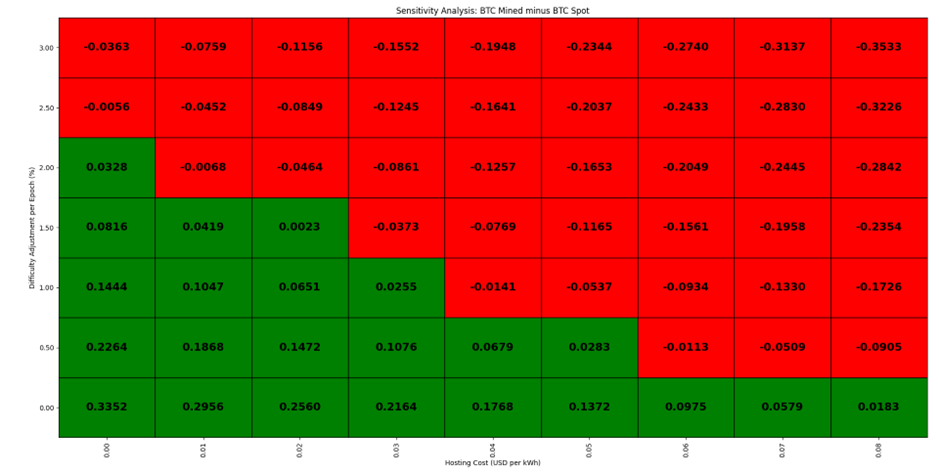
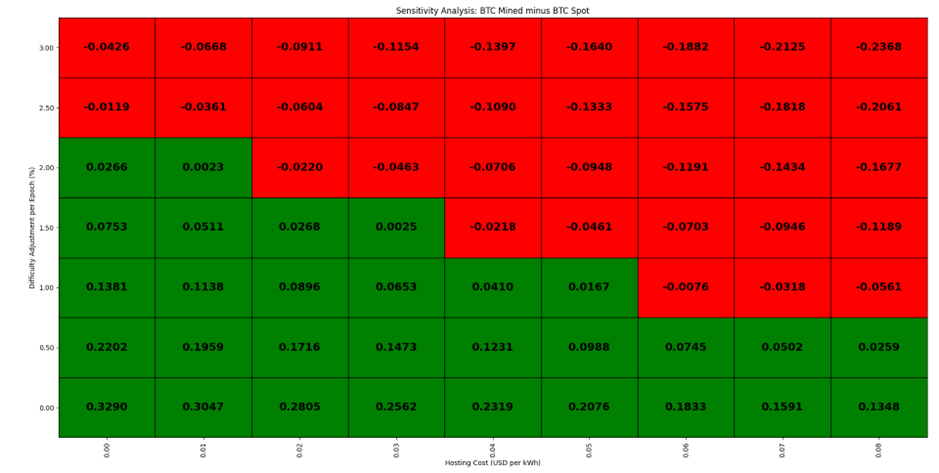
Among all the variables influencing mining profitability, three stand out as having a significantly greater impact than the rest: Bitcoin price, electricity costs, and difficulty growth per epoch. To simulate multiple scenarios, the following graphs present three sensitivity analyses. Each illustrates the difference between the Bitcoin obtained through mining, as estimated by the model, and the Bitcoin that would have been acquired by purchasing it on the market at day one, evaluated across a range of electricity costs per kWh and difficulty adjustment rates. Each table represents a different Bitcoin price forecast scenario: bearish, normal, and bullish. All of them represent a positive view on Bitcoin’s price appreciation in the near future, although in different dimensions. Inside the squares we can observer the final result of subtracting the bitcoin that would be accumulated in a mining project according to the model to the bitcoin that could have been bought on day one. If the square is green colored, mining is the most lucrative option. If the square is red colored, buying is the more profitable choice.
Bearish:
In 1 year from now: 120k
In 2 years from now: 150k
In 3 years from now: 125k
In 4 years from now: 180k
Normal:
In 1 year from now: 220k
In 2 years from now: 270k
In 3 years from now: 200k
In 4 years from now: 350k
Bullish:
In 1 year from now: 300k
In 2 years from now: 400k
In 3 years from now: 300k
In 4 years from now: 500k
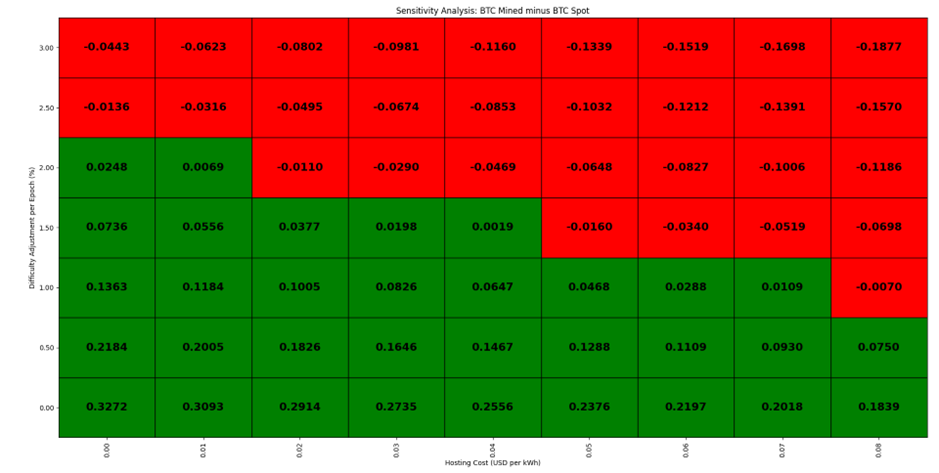
Looking at these tables and considering the earlier analysis of the anticipated growth of the network hashrate (base scenario of 1% per epoch), we can conclude that the highest price a miner would be willing to pay per kWh—while maintaining a margin of safety as advocated by the legendary value investor Benjamin Graham—is around 2.5 cents per kwh. Any price above this value, makes buying clearly the better risk-adjusted choice. The net bitcoin margins of a mining operation are simply not big enough to recoup the significant capex investment that any miners have to deploy at the beginning of the lifecycle of the project. If one doesn’t have access to deep mining expertise, bargaining power to acquire ASICs and very cheap electricity prices, stacking sats is clearly the option to go.
Hashrate and Bitcoin Treasury Companies – A match made in heaven?
While individuals may struggle to secure favorable financial conditions to deploy a mining operation, this is not an issue for corporations with easy access to capital. I have been following the discussion and debate surrounding Bitcoin Treasury Companies since the summer of 2024. Michael Saylor and the MicroStrategy team have been pioneers in this emerging field of Bitcoin Finance, making it one of the most exciting developments in the Bitcoin ecosystem. MicroStrategy transformed from a struggling business intelligence company with little future into a Bitcoin giant valued at over 100 billion US dollars. Many other companies have followed this path; some will succeed, while others will fail. Nonetheless, it is undeniable that, despite the risks these companies pose, they offer an asymmetrical bet layered on top of Bitcoin itself, a bet that is already characterized by its symmetrical risk-reward profile.
If there is a case to be made that in favourable financial conditions, individuals can acquire more BTC per dollar invested by mining rather than buying on the spot market, what then prevents companies and institutions from pursuing the same strategy? There are strong incentives that make buying hashrate and setting up mining operations appealing for Bitcoin treasury companies; while some of these reasons overlap with those of individual miners, others are distinct as we will see.
Blockspace is and will be a much more valuable commodity
Central banks usually manage transaction settlements between financial institutions. On the Bitcoin network, however, miners handle transaction settlements because they control the blockspace. At present, demand for blockspace is fairly low. But as Bitcoin adoption increases, and given that blockspace is as limited as bitcoin itself—with about 144 blocks created each day, each capable of holding up to 3,000 transactions, totaling just under 500,000 transactions daily—a more vibrant market for this scarce resource is anticipated to emerge. Bob Burnett from Barefoot Mining has thoroughly examined this subject, emphasizing the increasing demand and rising transaction fees that Bitcoin users will encounter. Consequently, transaction fees are projected to increase significantly, enhancing miner revenues. As Bitcoin adoption continues, blockspace is likely to become a highly valuable commodity. For all these reasons, mining is clearly aligned with Michael Saylor’s vision of MicroStrategy evolving into a Bitcoin bank over time.
Securing blockspace can also be seen as a strategic move for the future of any Bitcoin Treasury Company. If these companies want to become Bitcoin banks in the future, it’s important to guarantee that will be able to move their capital without paying a fortune. The only way to ensure this is by securing a share of the network’s hashrate.
A different type of a Dollar Cost Averaging Strategy
Typically, many Bitcoin enthusiasts follow a Dollar Cost Averaging (DCA) strategy, which consists of buying Bitcoin across multiple intervals to minimize exposure to price fluctuations. No one wants to purchase Bitcoin only to witness its value decline by 30% the next week. However, in mining, both individuals and firms can implement an alternative type of DCA. When Bitcoin’s price drops, miners must sell more BTC to cover energy expenses, leading to reduced earnings. Conversely, when Bitcoin’s price increases, they sell less and generate greater profits. This method works opposite to conventional DCA by producing more BTC when prices go up and less when prices fall. In traditional DCA, one accumulates fewer bitcoins when prices rise and more when prices decline.
By integrating spot Bitcoin purchases with hashrate investments, investors can more effectively protect themselves against Bitcoin’s fiat price volatility and minimize the risk of buying at market highs, thereby securing the average long-term returns of Bitcoin.
Cash flows from operations to cover dividends and interest payments on their issued financial instruments.
Another important consideration is that cash flows from mining operations can be used to meet debt obligations without needing to raise additional capital or sell Bitcoin. Since Bitcoin is widely seen as a risky asset by the broader market, how capital markets will respond during a severe bear market remains uncertain. Financial markets have experienced freezes in the past, and with most participants being nocoiners—who do not trust Bitcoin as reliable collateral and believe there is a real risk of it dropping to zero—there is no assurance that Bitcoin Treasury Companies will be able to access capital in challenging times. Selling Bitcoin could serve as a means to cover financial obligations, but while this might not signal the demise of the long-term outlook of a Bitcoin treasury company, it is a situation best avoided. Michael Saylor has made it clear that selling Bitcoin is not part of his strategy.
In the case of Microstrategy, we can easily estimate how much hashrate the company would have to acquire to meet their dividend and interest obligations. The company’s balance sheet presently includes $8.214 billion in convertible debt across six debt instruments. With four of these instruments being in the money and the remaining two carrying a zero interest rate, we can set these aside and focus on the preferred stocks. After doing some quick calculations, the annual dividend obligations on each preferred stock are the following:
· STRD - 120.8 million
· STRK - 105.57 million
· STRC - 279.28 million
· STRF – 109.88 million
In total, MicroStrategy is required to pay $615.53 million annually to meet its financial obligations. Given that Saylor and his team plan to continue issuing these instruments in the market, let’s assume this amount will continue to increase, namely to 800 million per year. Assuming a very favorable 70% margin, Microstrategy would have to generate around 1.143 billion dollars per year in mining revenues. Assuming a hashprice of $55 per PH, MicroStrategy would require approximately 57 exahashes of hashing power. To put this in perspective for those less familiar with mining, this equals the same hashrate as Marathon, the largest publicly traded miner in the United States. With an estimated power consumption of 20 MW per EH/s, such an operation would demand around 1,140 MW of electricity—comparable to the output of a nuclear power plant.
Deploying such a massive amount of hashrate is a tremendous challenge, requiring substantial proof of work. However, this approach aligns well with MicroStrategy’s objectives and Saylor’s view that Bitcoin is digital energy. After all, what better way to support Bitcoin than by contributing to that thing that secures it? Given MicroStrategy’s already significant financial obligations, this situation highlights a potential advantage for smaller Bitcoin company treasuries. While backing dividends with mining cash flows is a monumental task for MicroStrategy, it will likely be much more manageable for smaller firms. Traditional financial capital is likely to favor instruments that are fully backed by mining cash flows rather than those backed by Bitcoin itself. Utilizing mining cash flows in conjunction with overcollateralized credit instruments appears to be the most effective strategy for reassuring investors about a company’s capacity to fulfill financial obligations, facilitating increased capital acquisition and ultimately optimizing BTC returns/BTC Yield for common shareholders.
The biggest setback of buying hashrate
There is currently a race to accumulate the largest Bitcoin holdings, with companies holding the most Bitcoin reserves having the strongest balance sheets to support and issue Bitcoin-backed credit instruments. By investing in hashrate instead of purchasing Bitcoin directly on the spot market, miners are securing future Bitcoin rather than immediate ownership. Consequently, Bitcoin Treasury Companies need to include a Bitcoin discount rate in their models to account for the time factor involved and must consider this time aspect, along with the inherent risks of mining, when deciding whether to allocate part of their capital to acquiring hashrate.
Conclusion
In most situations, accumulating Bitcoin (sats) tends to be the optimal risk-adjusted strategy for both individual investors and Bitcoin treasury companies. However, for Bitcoin treasury companies that have access to mining expertise and affordable electricity, allocating a portion of capital raised in fiat markets to acquire hashrate can be a more advantageous approach. It is also important to note that these assessments do not take into account the complex interactions between Bitcoin price and hashprice. For instance, it is widely recognized within the mining community that the most profitable time to mine is during a bull market when Bitcoin’s price rises rapidly, while mining difficulty adjusts more slowly. Such scenario was not considered in the model. Additionally, tax considerations were not factored into these calculations.
As more companies enter this space, we can expect to see additional innovative methods to enhance BTC yield, such as managing a Bitcoin trading desk and providing liquidity to the Lightning Network to generate routing fees. One thing is for sure. Exciting developments lie ahead.
913209
Appendix - Model’s code written in python
import requests
import datetime
from scipy.interpolate import interp1d
from dateutil.relativedelta import relativedelta
import matplotlib.pyplot as plt
import numpy as np


def get_float_input(prompt):
    while True:
        value = input(prompt)
        try:
            return float(value)
        except ValueError:
            print("Please enter a valid number.")


def decimal_year(date):
    year_start = datetime.date(date.year, 1, 1)
    year_end = datetime.date(date.year + 1, 1, 1)
    year_length = (year_end - year_start).days
    day_of_year = (date - year_start).days
    return date.year + day_of_year / year_length


def get_bitcoin_price():
    url = "https://api.coingecko.com/api/v3/simple/price"
    params = {"ids": "bitcoin", "vs_currencies": "usd"}
    response = requests.get(url, params=params)
    data = response.json()
    return data["bitcoin"]["usd"]


# User inputs
bitcoinprice = float(get_bitcoin_price())
depreciation = get_float_input("What is the duration of the investment? (in years): ")
hash_rate = get_float_input("How much hash rate do you have? (TH/s): ")
network_hash_rate = get_float_input("What's the total network hashrate today? (EH/s): ")
difficulty_adjustment_percent = get_float_input("Difficulty adjustment per difficulty epoch (e.g., 2 for 2%): ")
tx_fees = get_float_input("Average tx fees per block (in BTC): ")
residual = get_float_input("Residual value of the ASICS at the end of the project (%): ")
hosting = get_float_input("What is your hosting cost per kWh? (USD): ")
efficiency = get_float_input("What is the efficiency of your ASICS (J/TH)?: ")
price_hardware = get_float_input("How much have you paid per TH/s? (USD):? ")
pool_fee = get_float_input("What's the pool fee and estimated downtime? (%): ") / 100

# Calculate electricity consumption and cost per day (corrected units kWh per day)
consumption = (hash_rate * efficiency * 60 * 60 * 24) / (3600 * 1000)  # kWh per day  # kWh per day
electricity_costs_dollars = hosting * consumption
fiat_investment = price_hardware * hash_rate
btc_spot = fiat_investment / bitcoinprice

# Calculate date range
full_years = int(depreciation)
fractional_year = depreciation - full_years
months = int(round(fractional_year * 12))
start_date = datetime.date.today()
end_date = start_date + relativedelta(years=full_years, months=months)
num_days = (end_date - start_date).days + 1
date_list = [start_date + datetime.timedelta(days=i) for i in range(num_days)]

# For BTC price interpolation: ask user for yearly predictions
price_predictions = {0: bitcoinprice}
years_needed = list(range(1, full_years + 1))
if depreciation != full_years:
    years_needed.append(depreciation)

for y in years_needed:
    while True:
        try:
            val = float(input(f"Enter your BTC price prediction at the end of {y} year : "))
            price_predictions[y] = val
            break
        except ValueError:
            print("Invalid number, please re-enter.")

# Prepare interpolation
x = list(price_predictions.keys())
y = list(price_predictions.values())
interp_func = interp1d(x, y, kind='linear', fill_value='extrapolate')

start_decimal_year = decimal_year(start_date)
years_passed = [decimal_year(d) - start_decimal_year for d in date_list]

# Cutoff date for subsidy change
cutoff = datetime.date(2028, 3, 30)


def run_mining_model(electricity_cost, difficulty_adj_percent):
    consumption_local = (hash_rate * efficiency * 60 * 60 * 24) / (3600 * 1000)  # kWh per day
    electricity_costs_dollars_local = electricity_cost * consumption_local
    fiat_investment_local = price_hardware * hash_rate
    btc_spot_local = fiat_investment_local / bitcoinprice

    start_date_local = start_date
    end_date_local = start_date_local + relativedelta(years=depreciation)
    num_days_local = (end_date_local - start_date_local).days + 1
    date_list_local = [start_date_local + datetime.timedelta(days=i) for i in range(num_days_local)]

    start_decimal_year_local = decimal_year(start_date_local)
    years_passed_local = [decimal_year(d) - start_decimal_year_local for d in date_list_local]

    btc_mined_cumulative_local = -btc_spot_local
    network_hash_rate_local = network_hash_rate  # EH/s reset per run

    for i, date in enumerate(date_list_local):
        year_passed = years_passed_local[i]
        btc_price = float(interp_func(year_passed))
        subsidy = 3.125 if date < cutoff else 1.5625

        if i > 0 and i % 15 == 0:
            network_hash_rate_local *= (1 + (difficulty_adj_percent / 100))

        network_hash_rate_ths = network_hash_rate_local * 1e6  # EH/s to TH/s

        btc_mined_day = (hash_rate / network_hash_rate_ths) * ((subsidy + tx_fees) * 144) * (1 - pool_fee)
        btc_costs_day = electricity_costs_dollars_local / btc_price
        btc_profit = btc_mined_day - btc_costs_day
        btc_mined_cumulative_local += btc_profit

    btc_price_last_day = float(interp_func(decimal_year(end_date_local) - start_decimal_year_local))
    proceeds_asic_fiat_local = (residual / 100) * fiat_investment_local
    proceeds_asic_btc_local = proceeds_asic_fiat_local / btc_price_last_day
    btc_mined_cumulative_local += proceeds_asic_btc_local

    return btc_mined_cumulative_local - btc_spot_local


# Run base simulation to generate series for plots
btc_data = {}
btc_mined_cumulative = -btc_spot
network_hash_rate_sim = network_hash_rate  # copy for simulation

for i, date in enumerate(date_list):
    year_passed = years_passed[i]
    btc_price = float(interp_func(year_passed))
    subsidy = 3.125 if date < cutoff else 1.5625

    if i > 0 and i % 15 == 0:
        network_hash_rate_sim *= (1 + difficulty_adjustment_percent / 100)

    network_hash_rate_ths = network_hash_rate_sim * 1e6  # EH/s to TH/s

    btc_mined_day = (hash_rate / network_hash_rate_ths) * ((subsidy + tx_fees) * 144) * (1 - pool_fee)
    btc_costs_day = electricity_costs_dollars / btc_price
    btc_profit = btc_mined_day - btc_costs_day
    btc_mined_cumulative += btc_profit

    btc_data[date.strftime('%Y-%m-%d')] = {
        "btc_subsidy": subsidy,
        "hashrate": hash_rate,
        "network_hash_rate": network_hash_rate_sim,
        "btc_mined_day": btc_mined_day,
        "btc_costs_day": btc_costs_day,
        "btc_profit": btc_profit,
        "btc_lumpsum": btc_spot,
        "btc_mined_cumulative": btc_mined_cumulative,
        "btc_price": btc_price
    }

# Add residual hardware value converted to BTC at end date
btc_price_last_day = btc_data[end_date.strftime('%Y-%m-%d')]['btc_price']
proceeds_asic_fiat = (residual / 100) * fiat_investment
proceeds_asic_btc = proceeds_asic_fiat / btc_price_last_day
btc_data[end_date.strftime('%Y-%m-%d')]['btc_mined_cumulative'] += proceeds_asic_btc

dates_dt = [datetime.datetime.strptime(d, "%Y-%m-%d") for d in btc_data.keys()]
hashrates = [btc_data[d.strftime('%Y-%m-%d')]['network_hash_rate'] for d in dates_dt]
btc_mined_per_day = [btc_data[d.strftime('%Y-%m-%d')]['btc_mined_day'] for d in dates_dt]
btc_costs_per_day = [btc_data[d.strftime('%Y-%m-%d')]['btc_costs_day'] for d in dates_dt]
btc_price = [btc_data[d.strftime('%Y-%m-%d')]['btc_price'] for d in dates_dt]
btc_mined_cumulative = [btc_data[d.strftime('%Y-%m-%d')]['btc_mined_cumulative'] for d in dates_dt]
btc_spot_timeseries = [btc_spot] * len(dates_dt)
final_cumulative_btc = btc_mined_cumulative[-1]

# Plot 1: Network Hashrate Over Time
plt.figure(figsize=(12, 6))
plt.plot(dates_dt, hashrates, label='Network Hashrate (EH/s)')
plt.xlabel('Date')
plt.ylabel('Hashrate (EH/s)')
plt.title('Network Hashrate Over Time')
plt.legend()
plt.grid(True)
plt.tight_layout()
plt.show()

# Plot 2: BTC Mined Per Day vs Electricity Cost
plt.figure(figsize=(12, 6))
plt.plot(dates_dt, btc_mined_per_day, label='BTC Mined Per Day')
plt.plot(dates_dt, btc_costs_per_day, label='BTC Electricity Cost Per Day')
plt.xlabel('Date')
plt.ylabel('BTC')
plt.title('BTC Mined per Day vs BTC Electricity Cost')
plt.legend()
plt.grid(True)
plt.tight_layout()
plt.show()

# Plot 3: Bar chart of BTC Spot vs Final Cumulative BTC mined
plt.figure(figsize=(8, 6))
bars = plt.bar(['BTC Spot', 'Final Cumulative BTC Mined'],
               [btc_spot, final_cumulative_btc],
               color=['blue', 'orange'])
for bar in bars:
    plt.text(
        bar.get_x() + bar.get_width() / 2,
        bar.get_height(),
        f'{bar.get_height():.6f}',
        ha='center', va='bottom', fontsize=12
    )
plt.ylabel('BTC')
plt.title('BTC Bought at Spot vs Final Cumulative BTC Mined')
plt.tight_layout()
plt.show()

# Plot 4: Bitcoin Price Over Time
plt.figure(figsize=(12, 6))
plt.plot(dates_dt, btc_price, label='Bitcoin Price (USD)')
plt.xlabel('Date')
plt.ylabel('BTC Price (USD)')
plt.title('Bitcoin Price Over Time')
plt.legend()
plt.grid(True)
plt.tight_layout()
plt.show()

# Plot 5: Cumulative BTC Mined vs BTC Bought at Spot
plt.figure(figsize=(12, 6))
plt.plot(dates_dt, btc_mined_cumulative, label='Cumulative BTC Mined')
plt.plot(dates_dt, btc_spot_timeseries, label='BTC Bought at Spot')
plt.xlabel('Date')
plt.ylabel('BTC')
plt.title('Cumulative BTC Mined vs BTC Bought at Spot')
plt.legend()
plt.grid(True)
plt.tight_layout()
plt.show()


# Sensitivity analysis for hosting cost and difficulty adjustment impact

hosting_costs = np.linspace(0, 0.08, 9)
difficulty_adjustments = np.linspace(0, 3, 7)
results = np.zeros((len(difficulty_adjustments), len(hosting_costs)))

for i, diff_adj in enumerate(difficulty_adjustments):
    for j, hosting_cost in enumerate(hosting_costs):
        results[i, j] = run_mining_model(electricity_cost=hosting_cost, difficulty_adj_percent=diff_adj)

fig, ax = plt.subplots(figsize=(12, 10))

# Create an empty grid of colors based on sign of results
colors = np.where(results > 0, 'green', np.where(results < 0, 'red', 'white'))

num_rows, num_cols = results.shape

for i in range(num_rows):
    for j in range(num_cols):
        rect = plt.Rectangle((j, i), 1, 1, facecolor=colors[i, j], edgecolor='black')
        ax.add_patch(rect)
        ax.text(j + 0.5, i + 0.5, f"{results[i, j]:.4f}",
                ha='center', va='center', color='black', fontsize=16, fontweight='bold')

ax.set_xticks(np.arange(num_cols) + 0.5)
ax.set_xticklabels([f"{v:.2f}" for v in hosting_costs], rotation=90)
ax.set_yticks(np.arange(num_rows) + 0.5)
ax.set_yticklabels([f"{v:.2f}" for v in difficulty_adjustments])

ax.set_xlabel('Hosting Cost (USD per kWh)')
ax.set_ylabel('Difficulty Adjustment per Epoch (%)')
ax.set_title('Sensitivity Analysis: BTC Mined minus BTC Spot')

ax.set_xlim(0, num_cols)
ax.set_ylim(0, num_rows)

plt.tight_layout()
plt.show()